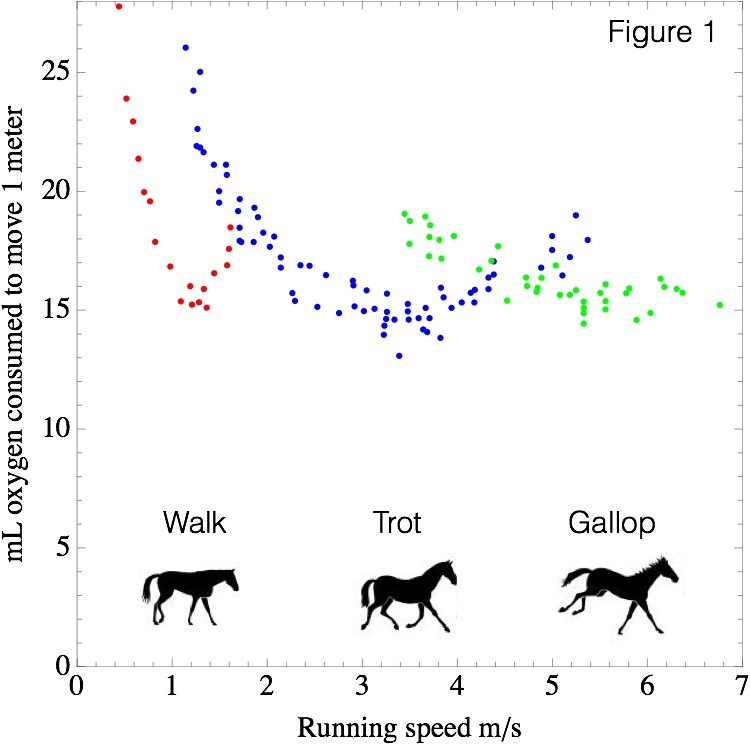
The piecewise defined function in Example 1.1.10 of the textbook was obtained from data on human walking and running. To illustrate how this was done, consider another example involving horse locomotion. Figure 1 shows data on the oxygen consumption of horses when moving at different speeds, for three different movement patterns or “gaits”: Walking (red), Trotting (blue), and Galloping (green).
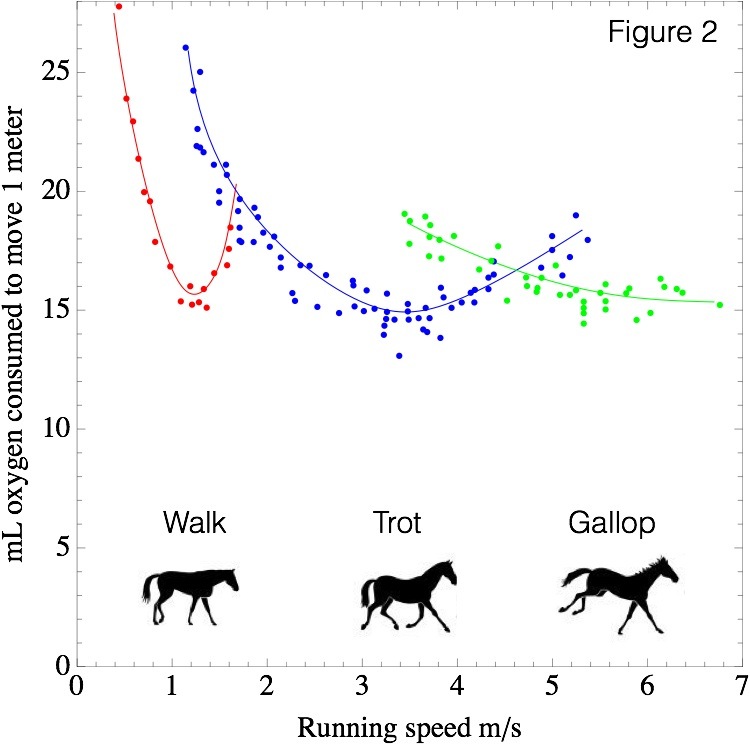
A curve giving the oxygen consumption as a function of speed can be drawn through the data for each gait. Figure 2 illustrates this idea.
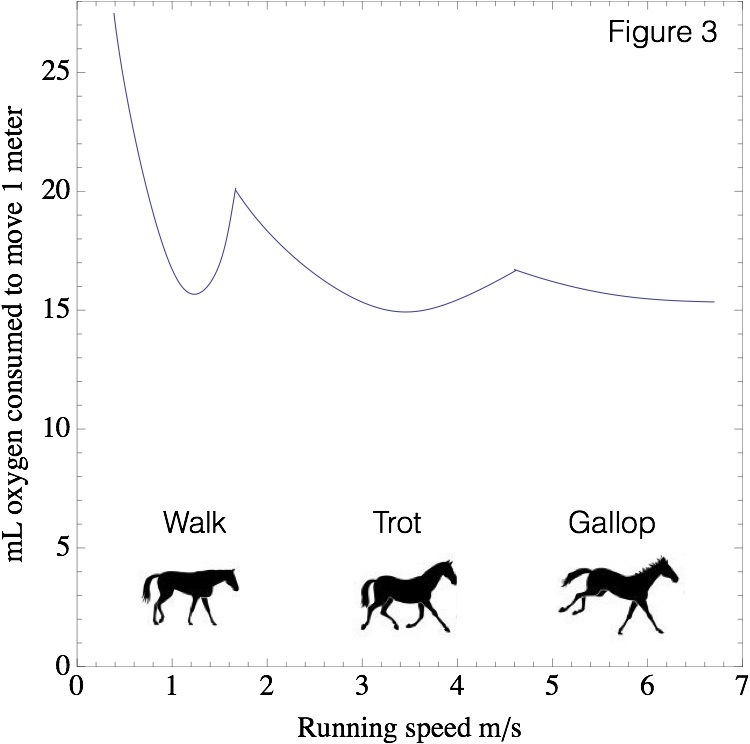
If a horse always uses the gait that minimizes oxygen consumption at any given speed, then oxygen consumption as a function of speed will be given by the piecewise defined function shown in Figure 3.
References
Data are from Hoyt, D.F. and C.R. Taylor. 1981. Gait and the energetics of locomotion in horses. Nature 292:239-240