The functions used in this example of the textbook were chosen for mathematical simplicity but they display the important qualitative proprieties of such relationships as seen in data. For example, below is a plot of the peak concentration of the antibiotic telithromycin in the plasma of an individual when given different doses of the drug, either orally (red) or by injection (blue). Drug dose is measured in mg per kg of body mass.
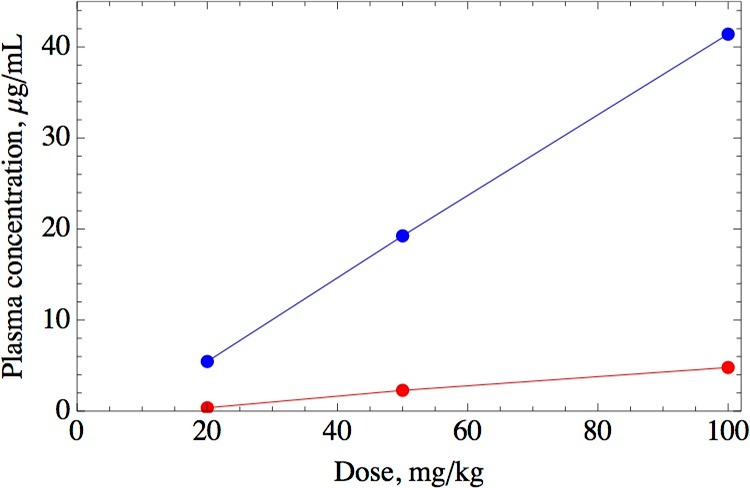
The blue curve above corresponds to the composition f(g(x)) in the last panel of Figure 1.3.11 of the textbook; the red curve above corresponds to the composition f(g(h(x))) in the last panel of Figure 1.3.11. Notice that the plasma concentration is always higher when the drug is administered by injection.
References
Data are from Lee, J.H. and M.G. Lee. 2007. Dose-dependent pharmacokinetics of telithromycin after intravenous and oral administration to rats: contribution of intestinal first-pass effect to low bioavailability. Journal of Pharmaceutical Science 10:37-50