The relationship between species number and area is one of the most widely documented patterns in ecology. Many different hypotheses have been developed to explain such patterns, and one of the most important is the Island Biogeography Model developed by Robert MacArthur and E.O. Wilson in 1967.
The idea behind this model is that the steady state number of species in a given area is determined by a balance between immigration of new species into the area and extinction. The model assumes that regions with smaller areas have populations with fewer individuals in them. Consequently, such populations are more likely to go extinct. This higher extinction rate in smaller regions thereby results in a smaller steady state number of species.
Below is another example of species-area curve, in this case for plants. The data are from 88 regions of different sizes.
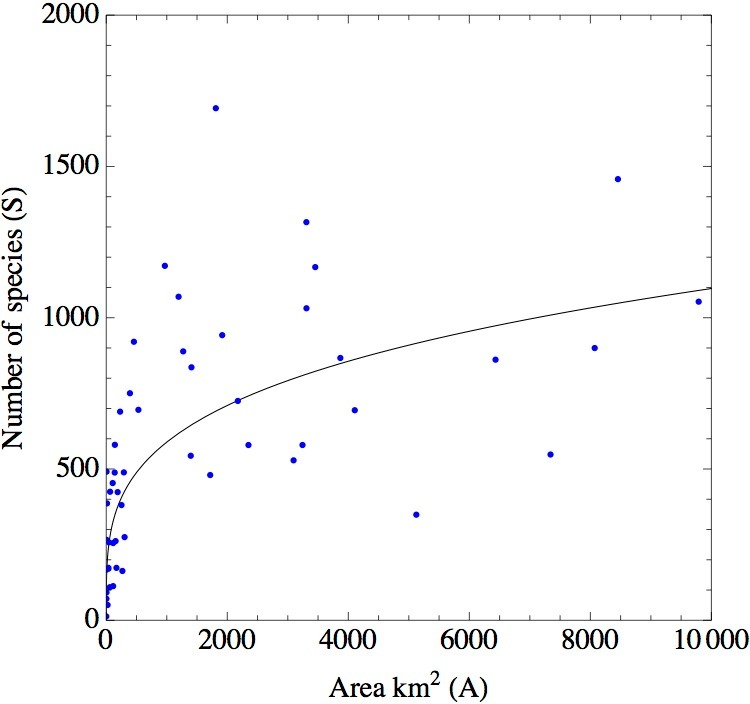
The function plotted in the figure is

The following animation plots log S against log A, and allows you to explore different slopes and intercepts for the line through the data.
The best fit gives an approximate intercept of 1.96 and a slope of 0.27. Therefore, the equation is

Exponentiating both sides with a base of 10 then gives
from above. You can download the data from the link on the left.
References
MacArthur, R.H. and E.O. Wilson. 1967. The theory of island biogeography. Princeton University Press
Data are from Lonsdale, W.M. 1999. Gobal patterns of plant invasions and the concept of invasibility. Ecology 80:1522-1536