The data from Gause’s experiment, along with a graph of the function P(t) in the textbook, is plotted below. An index of volume was used to quantify the Paramecium population size each day. The data can also be downloaded from the link on the left.
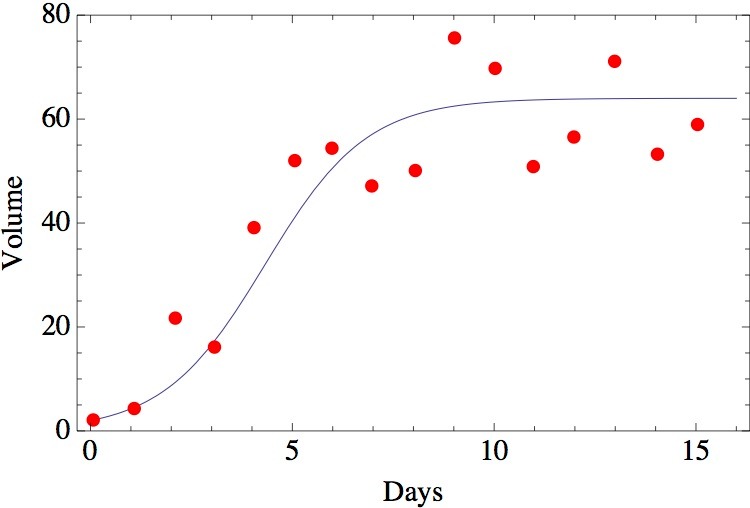
Note that the function P(t) is called a logistic function, not to be confused with the logistic difference equation in Sections 1.6 and 2.1 of the textbook. In Chapter 7 of the textbook we will see where the logistic function gets its name.
References
Gause, G.F. 1934. The struggle for existence. Williams and Wilkins, Baltimore.
An online version of Gause’s seminal work can be found here.