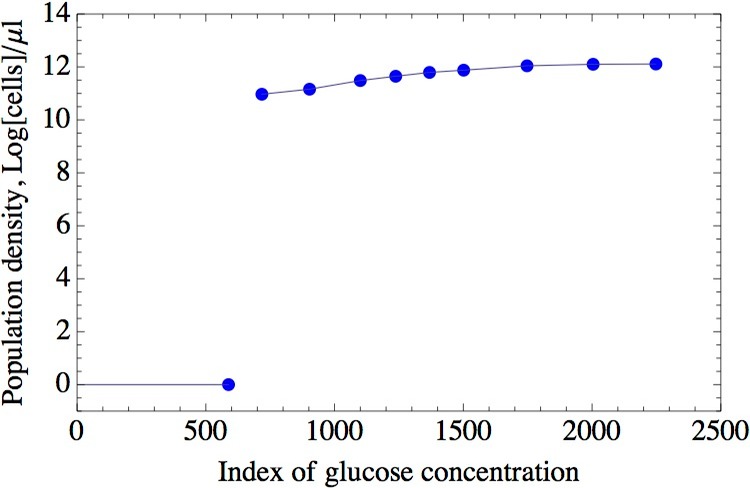
The function used in this example of the textbook is just one possible relationship between habitat quality and population size. As another example, the graph below plots data for the size of a yeast population as a function of habitat quality (measured as an index of glucose concentration). There is an abrupt collapse of the population once the habitat quality declines to a critical level.
References
Data are from Dai, L., D. Vorselen, K.S. Korolev, and J. Gore. 2012. Generic indicators for loss of resilience before a tipping point leading to population collapse. Science 336:1175-1177