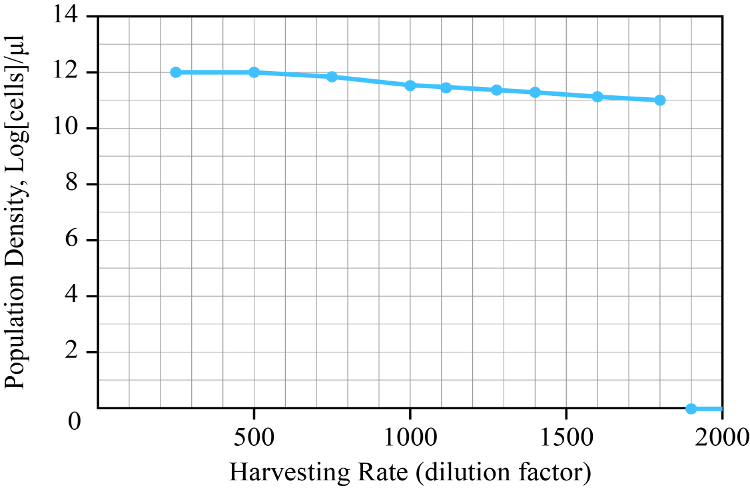
This example of the textbook demonstrates that population extinction can occur in different ways depending on how the population size is affected by births, deaths, and harvesting. In some cases the population size declines continuously to extinction when harvesting rate increases, and in other cases there is an abrupt (discontinuous) drop in population size to zero as the harvesting rate increases. The data plotted below illustrates an example of the latter situation for an experimental yeast population that was subjected to increasing levels of harvesting. In this experiment different levels of harvesting were obtained by diluting the yeast population different amounts.
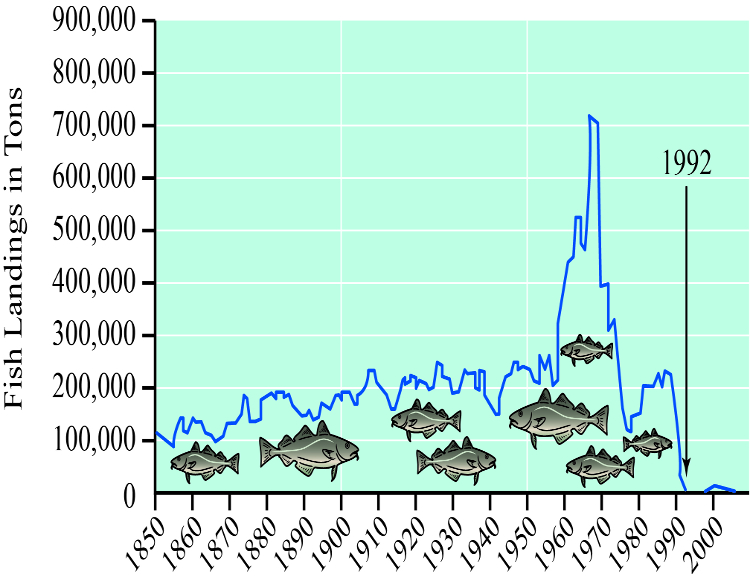
There is some suggestion that the collapse of the Atlantic cod fishery in 1992 might have been due to a similar phenomenon. The graph below shows the amount of fish harvested from the population over time. Starting in the 1960’s the harvest rate began to increase, resulting in larger catches over time. As the intensity of harvesting continued to increase through the 1970’s and 1980’s however, the population size started to decrease, and it eventually underwent a dramatic collapse in 1992.
References
Yeast data are from Dai, L., D. Vorselen, K.S. Korolev, and J. Gore. 2012. Generic indicators for loss of resilience before a tipping point leading to population collapse. Science 336:1175-1177
Cod data are from http://www.grida.no/graphicslib/detail/collapse-of-atlantic-cod-stocks-off-the-east-coast-of-newfoundland-in-1992_11e4#