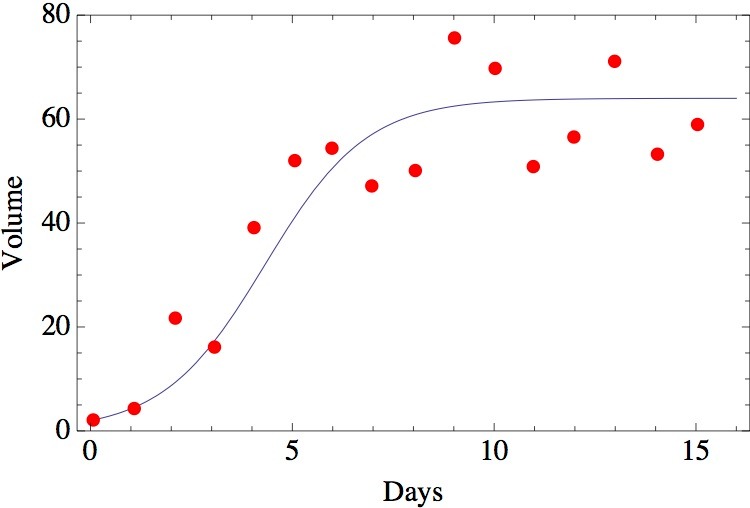
The data from Gause’s experiment, along with a graph of the function P(t) in Example 3.5.8 of the textbook, is plotted below. An index of volume was used to quantify the Paramecium population size each day. The data can also be downloaded from the link on the left.
Example 3.5.8 calculates the derivative of P(t) at t=8, which gives the population growth rate at that time. The graph below plots P(t) (black), as well as the derivative dP/dt (red) for t between 0 and 16.
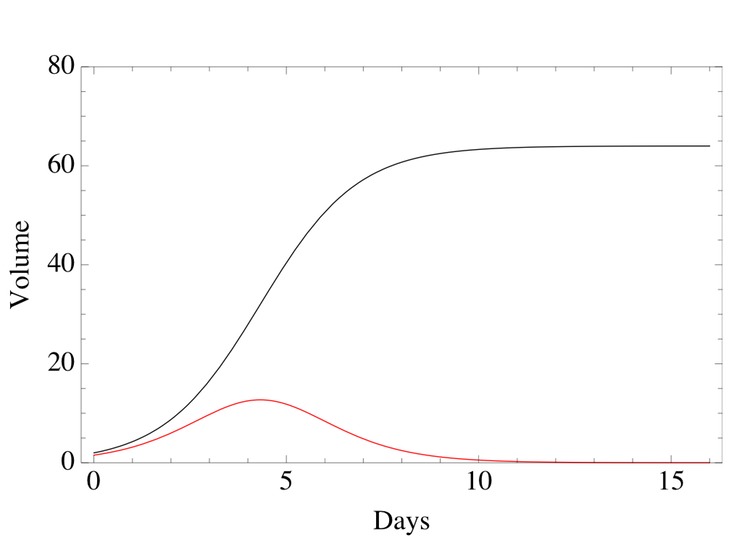
Notice that the population growth rate dP/dt is small when t=0, it increases to a maximum just before t=5, and then decreases to zero as t gets larger. This reflects the fact that initially the population is small and therefore there are very few offspring being produced. As the population size increases, so too does the growth rate because more individuals are reproducing (provided that resources are plentiful). Eventually, however, resources become scarce so that, even though the population size is quite large, the reproductive output of each individual declines to zero. This results in the population growth rate declining to zero.
References
Gause, G.F. 1934. The struggle for existence. Williams and Wilkins, Baltimore.
An online version of Gause’s seminal work can be found here.