Not surprisingly, much of the research on compensatory growth is related to livestock such as pigs, cows, and lambs. The data in Figure 1 below gives an example involving lambs (the data can be downloaded from the link on the left).
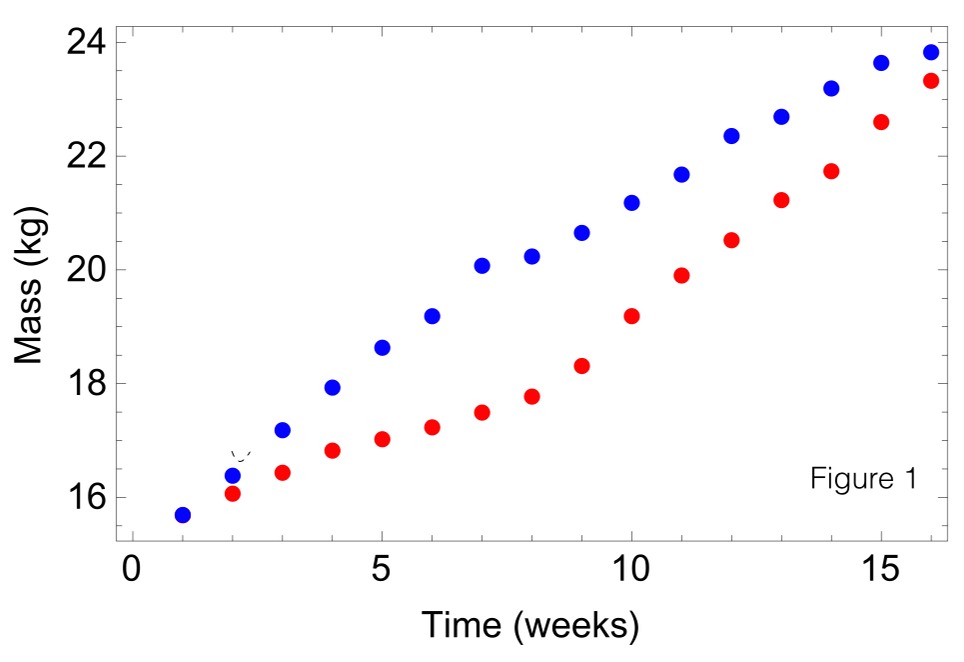
Blue dots are measurements of lamb weight when fed a normal diet for 16 weeks. Red dots are measurements of lamb weight when given a reduced diet for the first 8 weeks and then switched to a normal diet thereafter.
Results analogous to those from parts (a), (b), and (c) of Example 4.2.2 of the textbook are applicable to the data in Figure 1 as well. They can be interpreted as follows:
(a) There was at least one day during the experiment on which lambs fed a normal diet were growing at a rate equal to their average growth rate over the entire experiment.
(b) There was at least one day during the experiment on which lambs fed the manipulated diet were growing at a rate equal to their average growth rate over the entire experiment.
(c) There was at least one day during the experiment on which lambs fed a normal diet were growing at the same rate as lambs fed the manipulated diet.
References
Data are from http://www.fao.org/wairdocs/ilri/x5520b/x5520b14.htm