The model in Example 7.1.2 of the textbook is frequently used to predict the concentration of a drug in a patient when the drug is being delivered by an intravenous drip. As an example, researchers studied the effect of the antibiotic Vancomycin on 61 patients who had methicillin-resistant staphylococci infections (Wysocki et al. 2001). Each patient was first given a large ‘loading dose’ of Vancomycin by injection, and they were then maintained on a constant intravenous supply of the drug for more than 120 hours. The concentration of the drug in each patient was measured at different points in time. The average concentration in all 61 patients over time is shown in the following figure.
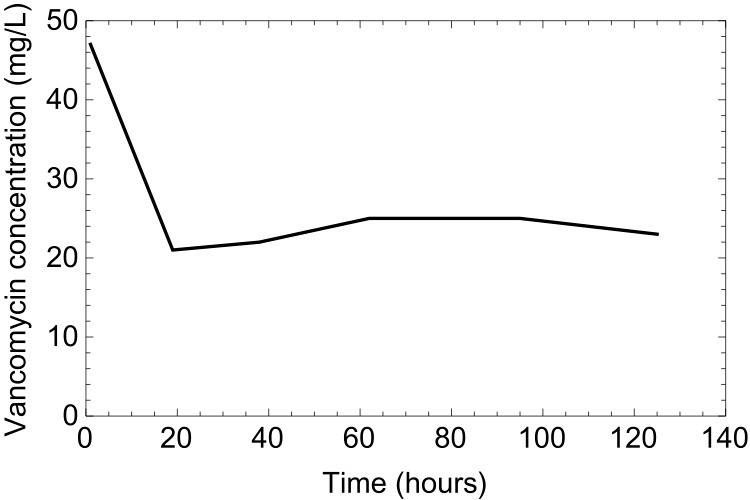
The data in the above figure show that the concentration initially decreases very quickly and then remains approximately constant after approximately 20 hours. This is very similar to the purple and green solution curves in Figure 7.1.9 of the textbook.
The loading dose given to patients at time t=0 ensures that the treatment starts at a high concentration. The concentration then decreases to a limiting value determined by a balance between the rate of infusion through the IV supply (denoted by A in Example 7.1.2) and the rate at which the drug is metabolized (denoted by k in Example 7.1.2). Example 7.1.2 shows that this limiting concentration is predicted to be A/k. This is useful because, if a physician knows the value of k for a typical patient, then they can choose an appropriate infusion rate A in order to achieve any desired limiting concentration.
References
Wysocki, M. et al. 2001. Continuous versus intermittent infsion of Vancomycin in severe Staphylococcal infections: prospective multicenter randomized study. Antimicrobial Agents and Chemotherapy 45:2460-2467