Example 8.8.3 of the textbook illustrates how we can analyze matrix models to understand their behavior in the long-term (that is, for large time t). This can be extremely useful in the context of conservation biology. To see how, we return to Example 8.5.1 of the textbook and the associated BB material on this website.
Example 8.5.1 of the textbook constructed a model for the population size of North Atlantic right whales. Fujiwara and Caswell’s (2001) model of right whales was then presented in the associated BB material on this website. It included four different life stages: (1) newborn calves, (2) immature females, (3) mature females, and (4) mature females caring for newborns. The matrix diagram for their model is presented below:
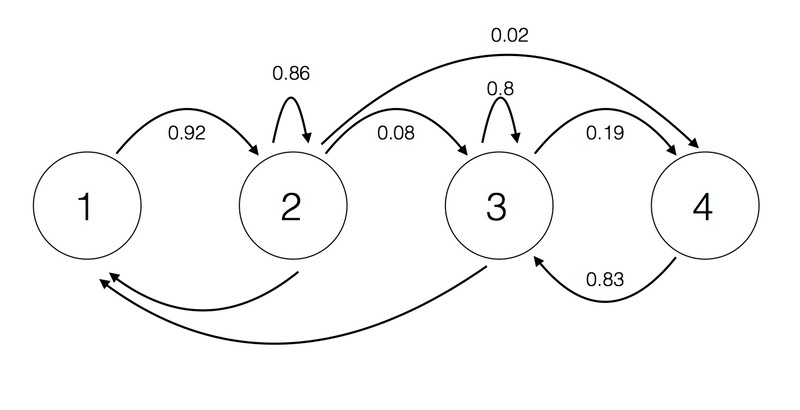
Fujiwara and Caswell (2001) then analyzed their model to predict the future fate of the right whale population. They showed that, in the long-term, the entire population of right whales is predicted to decline by a factor of approximately 0.98 each year, ultimately going extinct. This long-term behaviour, in which all life stages are predicted to decline by the same factor each year, is similar to our findings in Example 8.8.3. The growth factor of 0.98 for the right whale population is an eigenvalue of the matrix from the right whale model just as the growth factor of 1.18 is an eigenvalue of the matrix Q in the model of Example 8.8.3.
Fujiwara and Caswell (2001) went further and considered how changes in the entries of the matrix in their model affected the magnitude of this eigenvalue. This allowed them to determine if there are ways that we might intervene and prevent the population from going extinct.
References
Fuijwara, M. and H. Caswell. 2001. Demography of the endangered North Atlantic right whale. Nature 414:537-541