Age-structured matrix models like that from Example 8.8.5 of the textbook are widely used as a means of predicting the size of human populations in the future. As an example, the U.S. Census Bureau uses such models to make predictions about the number of people of different ages in the U.S. The following animation show their predictions for several age classes from 2015 through to 2060. The numbers are in thousands of individuals.
In Example 8.8.5 of the textbook we plotted the fraction of a population that is made up of different age classes over time. We can do the same for the above U.S. population predictions, giving the following figure:
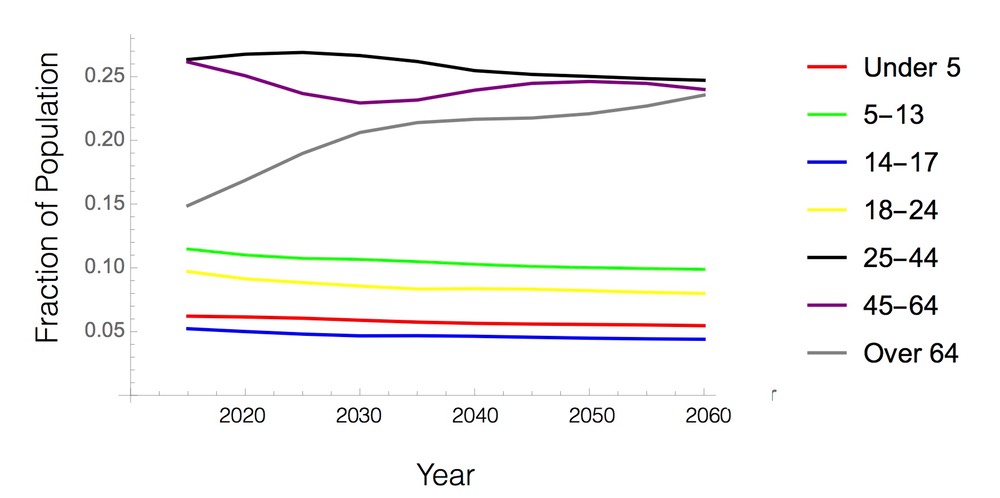
You can see that the biggest predicted change is for individuals over 64 years old to make up a greater and greater fraction of the population.
The U.S. Census Bureau website provides a wide variety of data and other tools that can be used to explore how the U.S. population is expected to change over the next 40 years.