SARS, or Severe Acute Respiratory Syndrome, is a viral respiratory disease. In 2002-2003 a SARS outbreak that started in southern China spread to several countries throughout the world. This caused significant concern because individuals infected with the virus had a 10% chance of dying from the disease. In 2004 the disease was eradicated through a variety of public health measures.
Mathematical models played an important role in assessing how best to control the spread of SARS, as well as the likely effectiveness of new treatments such as vaccines that might be developed. The basic reproduction number R0 is an important quantity in these mathematical studies because any intervention that can reduce R0 below 1 will eradicate the disease.
Example 9.1.12 of the textbook provides an example of the basic reproduction for a simplified model. Gumel et al. (2004) developed a more complex model and constructed a contour plot for R0 like that of Figure 9.1.17c of the textbook in order to assess the consequences of different interventions. Below is a plot from their publication. The vertical axis is the average number of days that elapse before a symptomatic person is isolated in a hospital. The horizontal axis is a measure of the transmissibility of the virus once the person is isolated in a hospital.
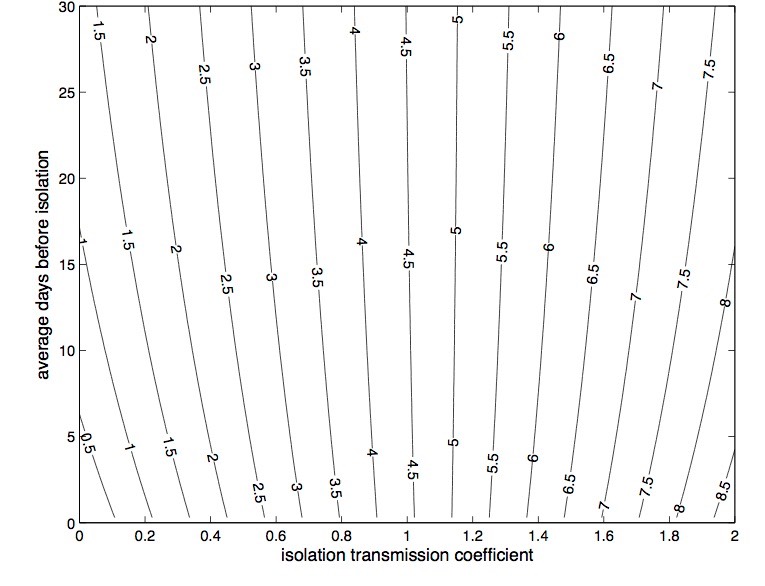
Notice that the contour lines corresponding to a value of R0 less than 1 lie in the lower left corner of the plot. This means that, to eradicate SARS using isolation alone, the isolation of symptomatic individuals would have to be done very quickly and the transmissibility of the virus would have to be very low once a person was isolated .
References
Gumel, A. et al. 2004. Modelling strategies for controlling SARS outbreaks. Proceedings of the Royal Society, B 271:2223-2232